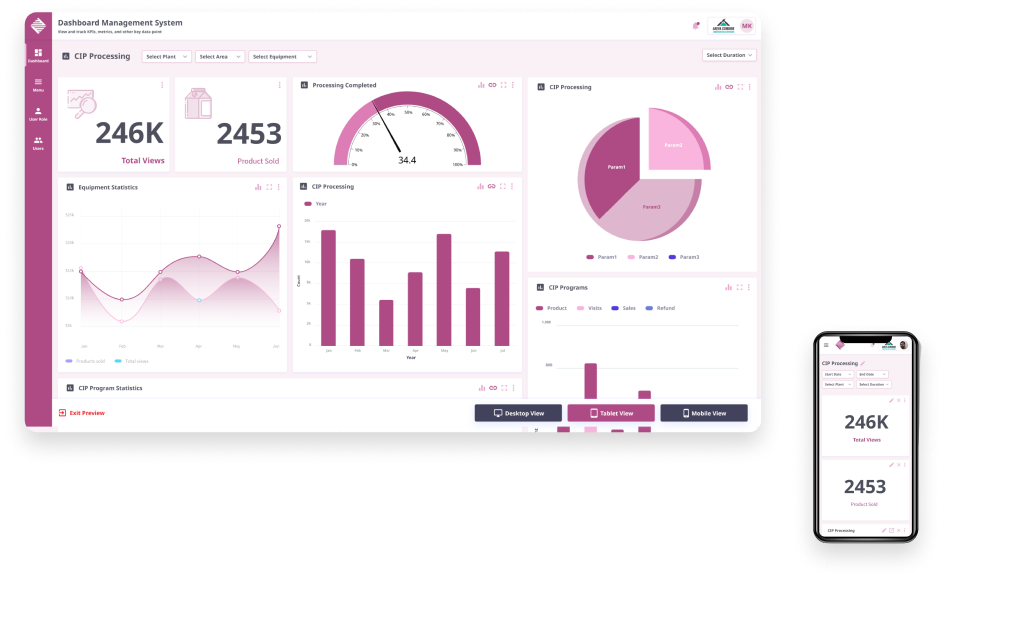
Creating a Progressive Web Application and Online Portal (Digital Exp.)
Challenges:
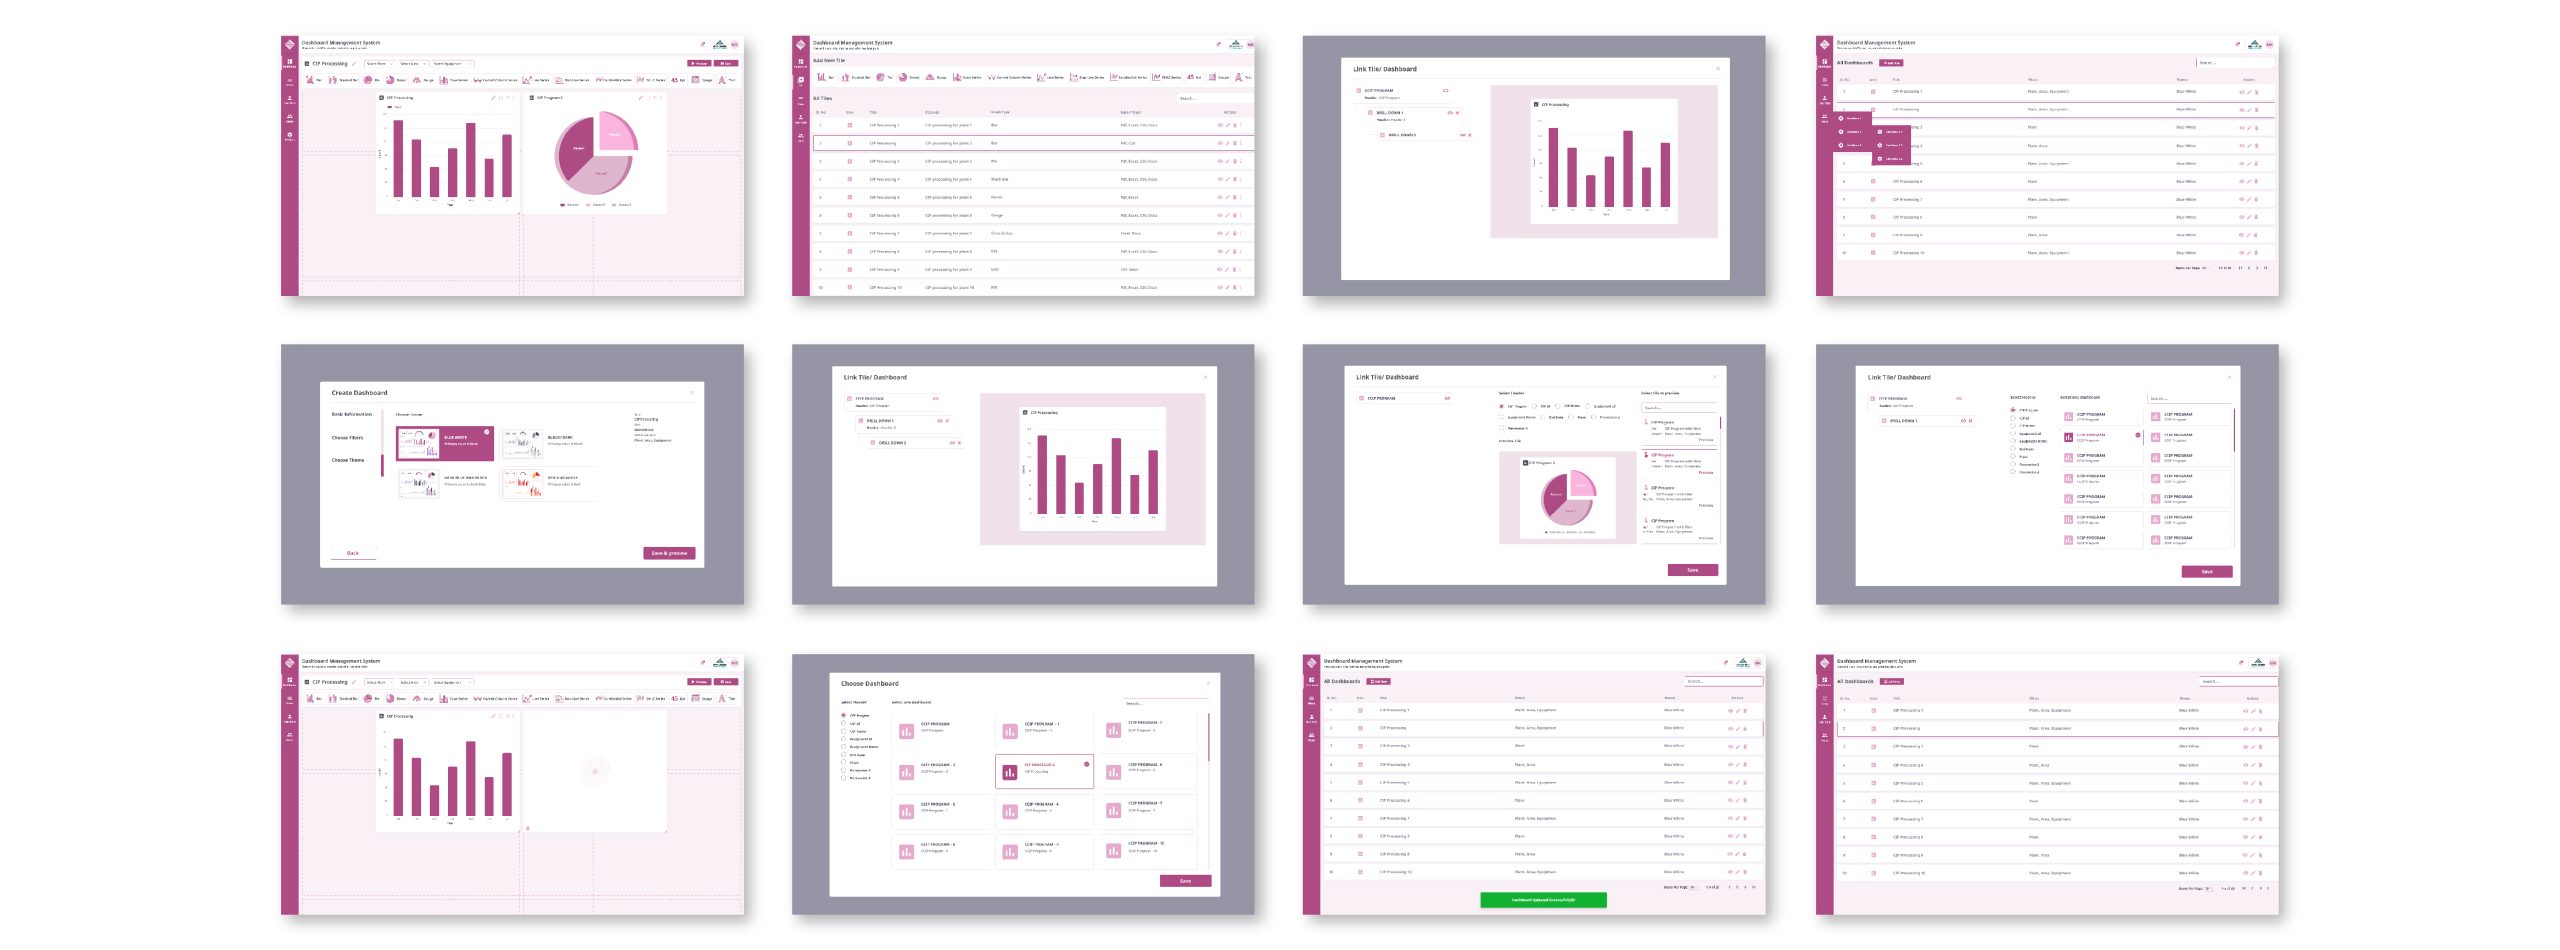
To gain a better understanding of the internal business processes. To have a better understanding of key members and to develop several layers of data accessibility. Designing and development of the data dashboard UI which is easy to navigate and organizes the analytics in a way that is easy to understand for all individuals in the key roles. To provide as many chart kinds as possible for visualising the required data. To make the whole platform dynamic, allowing each stakeholder to personalise the data dashboard to meet their own requirements.
Sector
Manufacturing
Client :
World’s leading multinational food packaging and processing solutions company.
What we did
Data Visualization
Consultancy
Dashboards
Sector
Manufacturing
Client :
World’s leading multinational food packaging and processing solutions company.
What we did
Data Visualization
Consultancy
Dashboards
Challenges:
To gain a better understanding of the internal business processes.
To have a better understanding of key members and to develop several layers of data accessibility.
Designing and development of the data dashboard UI which is easy to navigate and organizes the analytics in a way that is easy to understand for all individuals in the key roles.
To provide as many chart kinds as possible for visualising the required data.
To make the whole platform dynamic, allowing each stakeholder to personalise the data dashboard to meet their own requirements
This digital platform (data Dashboard) assisted our client in efficiently tracking multiple data sources, converting data into easy-to-understand visuals such as graphs and charts on a dashboard via interactive UI/UX, and presenting data to the user in a consolidated and relevant UI for forward planning and critical management decisions. As a result, multiple processes and departments were able to make decisions more quickly. Management now has a bird’s eye view of the company’s overall operations and performance. This has a direct positive effect on the company’s profitability.